Daily Analysis By FXGlory

FXGlory Ltd

New member
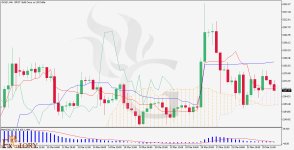
XRPUSD Insight for 25.03.2024


XRPUSD-H4-Daily--Technical-Analysis.jpg


Time Zone: GMT +2
Time Frame: 4 Hours (H4)


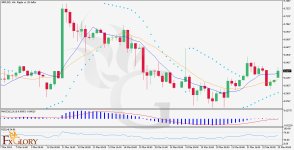
The H4 timeframe analysis for XRPUSD indicates a positive turn, as evidenced by its climb above the 9-period and 17-period moving averages, hinting at a developing bullish trend. The positive momentum is further validated by the MACD, which shows a bullish convergence. The RSI, standing at 54, reveals that the asset is not yet in the overbought zone, suggesting there is space for upward movement. The bullish narrative is reinforced by the Parabolic SAR's indicators, which are positioned below the current candlesticks, indicating sustained upward pressure. The chart shows a critical support level at approximately $0.58 - $0.60, with the price now testing a pivotal resistance level that, if surpassed, could lead to further bullish momentum. Traders are encouraged to keep a close watch on Ripple-related updates and global economic factors that could influence the USD.


Disclaimer: This commentary is for informational purposes only and should not be construed as investment advice. Traders should conduct their own investigation and assess their risk appetite before making any trading decisions.


Access more in-depth market analysis and strategic trading advice by visiting fxglory.com


FXGlory
25.03.2024


FXGLORY.gif
 

FXGlory Ltd

New member
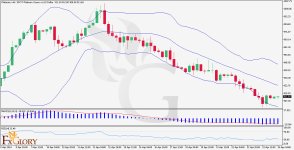
Gold Analysis Report for March 26, 2024


FX.Technical-Analysis-GOLDUSD-XAUUSD-H4-Mar-26th-2024.jpg


Time Zone: GMT +2 Analysis
Timeframe: 4-Hour Chart


Fundamental Overview:
Gold's status as a premier safe-haven investment means it reacts sensitively to worldwide economic fluctuations, monetary policy shifts, and geopolitical uncertainties. Movements in interest rates and inflation can greatly affect the price of gold. Additionally, demand from consumers, investment sectors, and central banks is crucial for determining its market value. Presently, the market's attitude towards gold might be shaped by these fundamental elements.


Market Dynamics: Analysis of the GOLD on the 4-hour timeframe reveals a pattern of volatility, with a notable recent surge followed by a period of consolidation. This scenario indicates a market experiencing uncertainty, characterized by a tug-of-war between buyers and sellers. The presence of closely packed, small candlesticks suggests a lack of clear market direction.


Technical Insights:

MACD Indicator:
The MACD histogram's position below the zero line signals a bearish trend, yet the narrowing gap between the MACD lines points to a potential shift in market momentum.
Ichimoku Kinko Hyo: With prices trading below the Ichimoku cloud, a bearish outlook is suggested. However, a recent Tenkan-sen over Kijun-sen crossover may signal an upcoming trend reversal.


Support and Resistance Levels:

Support:
The immediate support is observed at the recent lows, indicating a hesitancy to decline further.
Resistance: Resistance is noted at peaks prior to retracements, where the balance shifts in favor of selling over buying.

Analysis Summary: The 4-hour GOLD chart points to a volatile and slightly bearish market, as inferred from the MACD and Ichimoku indicators. Nonetheless, signs of bullish sentiment through the Ichimoku crossover and price consolidation call for cautious optimism. Traders should remain vigilant for clear trend signals and consider external economic, policy, and geopolitical factors affecting gold. Implementing sound risk management strategies is advised due to the inherent unpredictability of the gold market.


Disclaimer: This report is for informational use only and should not be construed as investment advice. Trading decisions should reflect an individual's risk appetite, market understanding, and comprehensive research.


FxGlory
26.03.2024

FXGLORY.gif
 

FXGlory Ltd

New member
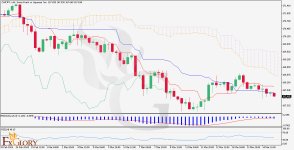
CHFJPY analysis for 28.03.2024


CHFJPYH4-Daily-analysis-FX-H4-03.28.jpg


Time Zone: GMT +2
Time Frame: 4 Hours (H4)


Fundamental Analysis:
On the H4 timeframe, the CHF/JPY pair exhibits a bearish trend, with key indicators and price action signaling a continued downward movement. Fundamentally, the Swiss Franc's status as a 'safe-haven' currency and the Japanese Yen's sensitivity to Japan's economic health and policy decisions play crucial roles in influencing this pair's dynamics. Technical analysis reveals a consistent pattern of lower highs and lower lows, with the price currently below the Ichimoku cloud, further supporting the bearish outlook. The MACD and RSI indicators align with this sentiment, suggesting strong bearish momentum without yet entering oversold territory. Support and resistance levels are identified at 167.315 and 168.575, respectively. Given these factors, traders might consider bearish strategies, closely monitoring economic indicators from both Switzerland and Japan for potential market shifts. Proper risk management, including setting stop losses above the Ichimoku cloud resistance, is advised to mitigate risks associated with sudden trend reversals.


Disclaimer: The provided analysis is for informational purposes only and does not constitute investment advice. Traders should conduct their own research and analysis before making any trading decisions.


FxGlory
28.03.2024
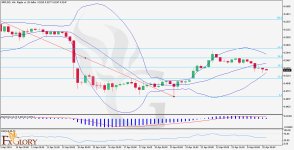

image_2024-02-15_07_27_41.gif
 
Last edited:

FXGlory Ltd

New member
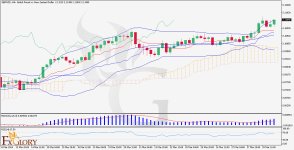
Analysis of GBPNZD as of March 29, 2024


GBPNZDH4-Daily-Technical-Analysis.jpg


In the GMT +2 time zone, with a focus on the 4-hour chart:


Economic Context:

The economic relationship between the UK and New Zealand is captured in the GBPNZD exchange rate. Influences on this pair are driven by the comparative interest rates set by the Bank of England and New Zealand's Reserve Bank, alongside each country's trade performance and wider geopolitical influences. New Zealand's dairy trade, a substantial export, and the UK's evolving post-Brexit policies are crucial in determining the direction of this currency pair.


Market Dynamics:
The 4-hourly trajectory of GBPNZD portrays an ascending trend, as evidenced by its position relative to key moving averages and the formation of consecutive higher peaks and troughs. This pattern denotes robust bullish impetus, further highlighted by a recent upward break.


Indicator Insights:
Bollinger Bands:
Presently, the price is hovering around the upper edge of the Bollinger Bands, signaling heightened market volatility and a possible encounter with resistance.
Ichimoku Cloud: The price resides above a green-hued Ichimoku Cloud, suggesting a bullish stance with the cloud providing support.
RSI: With an RSI over 60, there's an indication of considerable buyer interest, yet it also hints at a potential nearing of overbought conditions.
MACD: The MACD histogram's position above zero and the MACD line's ascent above its signal counterpart reinforce the market's bullish sentiment.


Levels to Watch:
Supportive levels are identified at the Ichimoku Cloud's upper limit and subsequently at the central line of the Bollinger Bands. Conversely, resistance levels are expected at the latest peak, extending to the vicinity of the upper Bollinger Band.


Strategic Outlook:

Current patterns and technical indicators, such as Bollinger Bands, Ichimoku, RSI, and MACD, support the bullish momentum exhibited on the GBPNZD H4 chart. Investors are advised to stay alert to future economic disclosures and policy adjustments from the involved central banks, which may sway the ongoing trend. Proximity to the upper Bollinger Band and an RSI flirting with the overbought threshold necessitate a cautious approach to risk management, preparing for potential reversals.

Note: The analysis provided herein is intended solely for informational purposes and should not be construed as investment advice. Individual research and due diligence are recommended for anyone considering trading decisions.


FxGlory
29.03.2024


FXGLORY.gif
 

FXGlory Ltd

New member
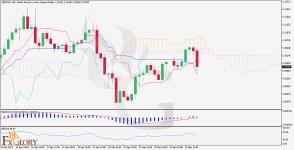
GOLDEURO Analysis For 02.04.2024

GOLDEUROH4-Daily-Technical-Analysis.jpg

Time Zone: GMT +2
Time Frame: 4 Hours (H4)


Fundamental Analysis:


Gold priced in euros reflects not only the inherent characteristics affecting gold's demand and supply but also the relative strength of the euro currency. Factors influencing gold include central bank policies, inflation rates, and economic uncertainty, which often boosts its appeal as a safe-haven asset. Conversely, the euro's value is impacted by the European Central Bank's interest rate decisions, economic data from the Eurozone, and geopolitical events within Europe. The ongoing economic recovery from global disruptions could impact gold as investors balance risk with the security of gold investment.


Price Action:


The H4 chart for GOLDEURO demonstrates a strong uptrend, with price action forming a consistent pattern of higher highs and higher lows. Recently, the market has moved upwards with increased momentum, indicating strong buyer interest. The price is maintaining well above the moving averages, suggesting a solid uptrend with potential for continuation.


Key Technical Indicators:

RSI (Relative Strength Index):
The RSI is above 70, indicating a strong buying momentum, although it also suggests caution as the market may soon enter overbought territory.

MACD (Moving Average Convergence Divergence): The MACD line is above the signal line and the histogram is positive, supporting the current bullish trend. However, the histogram bars appear to be shortening, which could indicate a slowdown in momentum.

Bollinger Bands: The price is trading near the upper Bollinger Band, showing that it is at the higher end of its current volatility range. The widening of the bands suggests increased market volatility.


Support and Resistance:

Support:
The nearest level of support is likely the middle Bollinger Band, which aligns with a recent consolidation area.

Resistance: The immediate resistance is potentially the recent high, which could be at or near the upper Bollinger Band.


Conclusion and Consideration:

The GOLDEURO pair is in a strong uptrend on the H4 chart, as indicated by price action and the alignment of technical indicators. The RSI and position of the price relative to the Bollinger Bands call for vigilance for a potential retracement due to overbought conditions. Investors should monitor Eurozone economic indicators and any changes in market sentiment towards gold. As the price approaches potential resistance, incorporating risk management strategies is prudent. Any trading decision should consider both the technical posture and the broader fundamental economic context.


Disclaimer: This analysis is for informational purposes only and should not be considered investment advice. Traders should perform their own due diligence before engaging in any transactions.


FxGlory
02.04.2024


FXGLORY.gif
 

FXGlory Ltd

New member
EURAUD analysis for 03.04.2024


EURAUDH4.jpg


Time Zone: GMT +2.
Time Frame: 4 Hours (H4)


Fundamental Analysis:

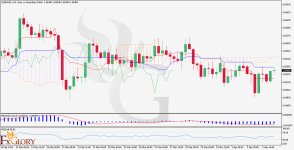
The EURAUD pair is currently showcasing signs of consolidation within the 4-hour (H4) timeframe, reflecting a period of indecision among traders. From a fundamental perspective, the influence of economic indicators, central bank policies, and geopolitical stability within the Eurozone and Australia continues to play a crucial role in determining the pair's movement. Technical analysis reveals mixed signals; while the interaction with the Ichimoku Cloud suggests potential support or resistance, the RSI and MACD indicate a neutral to slightly bullish market sentiment without clear momentum.

In light of the current market conditions, the near-term outlook for EURAUD appears neutral with a slight inclination towards bullishness, contingent upon the pair's break above or below the Ichimoku Cloud for a more definitive market direction. Traders are advised to keep a close eye on upcoming fundamental developments, as these can significantly impact market sentiment and price trajectories. As always, it's essential for individual traders to perform their own due diligence and align their trading decisions with their personal risk management strategies.


Disclaimer: This analysis is for informational purposes only and should not be considered investment advice. Traders should perform their own due diligence before engaging in any transactions.


FXGlory
03.04.2024


image_2024-02-15_07_28_16.gif
 

FXGlory Ltd

New member
GBPCAD analysis for 04.04.2024


GBPCADH4-Daily-Analysis.jpg


Time Zone: GMT +2
Time Frame: 4 Hours (H4)


Fundamental Analysis:


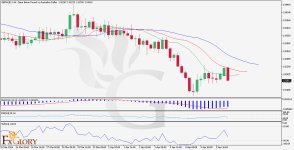
The GBPCAD pairing showcases a bearish trajectory as of April 4, 2024, underlined by the economic interplay and contrasting monetary policies between the UK and Canada. With political and economic dynamics at play, including oil price fluctuations and Brexit outcomes, the currency pair's recent price actions reveal a sustained downtrend marked by lower highs and lows. Technical analysis further illustrates this bearish sentiment through indicators like the Alligator, MACD, RSI, and William's %R, albeit with a phase of consolidation hinting at potential volatility ahead.

This period of slight retracement amid a dominant bearish trend underscores the importance of vigilance for traders, particularly in anticipation of forthcoming economic data releases from both nations. The mixed signals from key technical indicators suggest a cautious approach, advocating for adaptable trading strategies that incorporate stop-loss measures to navigate the expected fluctuations. As we brace for the impact of new economic reports, traders are reminded of the significance of informed decision-making based on thorough analysis and individual risk tolerance.


Disclaimer: This analysis is intended for informational purposes only and should not be construed as investment advice. Decisions should be made based on individual research and risk tolerance.


FxGlory
04.04.2024


image_2024-02-15_07_27_41.gif
 

FXGlory Ltd

New member
GBPAUD analysis for 08.04.2024


GBPAUDH4.jpg


Time Zone: GMT +2
Time Frame: 4 Hours (H4)


Fundamental Analysis:

The GBP/AUD currency pair reflects the complex interplay between the British and Australian economies, with factors such as interest rate differentials, economic data releases, and global risk sentiment playing key roles in its valuation. The Australian dollar's correlation with commodity prices, particularly metals and mining exports, and the British pound's sensitivity to political events, including developments related to Brexit and trade agreements, significantly influence the pair's movement. Given the current economic trends and policy decisions in both countries, these fundamental factors are expected to be pivotal in determining the pair's direction in the upcoming trading sessions.


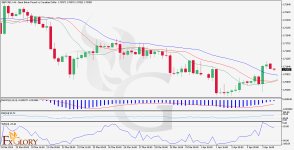
From a technical perspective, the GBP/AUD has been on a bearish trajectory, as indicated by the formation of lower highs and lower lows on the H4 chart. Despite a recent corrective rally, the pair remains under a broader bearish influence, with technical indicators sending mixed signals. The Alligator indicator suggests a bearish phase, while a diminishing negative momentum signaled by the MACD hints at a potential slowdown in the bearish trend. With the RSI and Williams Percent Range indicating a neutral to slightly bearish sentiment, the market appears indecisive. Traders are advised to keep an eye on potential continuations of the bearish trend or signs of a bullish reversal, particularly a breakout above the Alligator’s lines. The mixed technical signals, alongside crucial fundamental factors, suggest a cautious approach with diligent risk management for those looking to trade this pair.


Disclaimer: This analysis is for informational purposes only and does not constitute investment advice. Traders should conduct their own research and analysis before making any trading decisions.


FxGlory
08.04.2024


image_2024-02-15_07_27_41.gif
 

FXGlory Ltd

New member
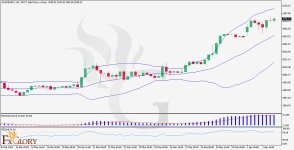
USDZAR analysis for 10.04.2024


USDZARH4.jpg


Time Zone: GMT +2
Time Frame: 4 Hours (H4)


Fundamental Analysis:


The USD/ZAR pair reflects the economic dynamics between the United States and South Africa. Key fundamental factors that could influence USD/ZAR include interest rate decisions from the Federal Reserve and the South African Reserve Bank, economic data releases such as employment statistics, GDP growth, trade balances, and manufacturing data. The U.S. dollar is a primary reserve currency and is often influenced by global risk sentiment and international trade policies, while the South African rand is significantly impacted by domestic economic performances, political stability, and commodity exports, particularly precious metals.


Price Action:


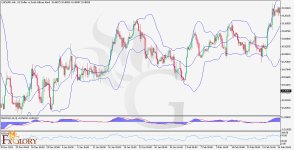
The H4 chart for USD/ZAR indicates a volatile trend with recent bullish momentum, marked by higher highs and higher lows. The price action has breached the upper Bollinger band, which might signify potential overbought conditions or a strong uptrend continuation.


Key Technical Indicators:

Bollinger Bands:
The price is currently above the upper Bollinger Band, which can sometimes indicate an overextended market. However, this can also signify a strong uptrend if the price remains persistently above the band.

MACD: The MACD histogram is above the baseline, with the signal line below the histogram, which supports the bullish momentum. The divergence of the lines suggests increasing bullish strength.

RSI: The RSI is above the 50 mark, leaning towards overbought territory, which suggests strong buying pressure. However, caution should be taken if it approaches the overbought threshold of 70.


Support and Resistance:

Support
: The nearest support level for USD/ZAR on the H4 chart is at the lower Bollinger Band or the most recent swing low.

Resistance Should the bullish trend continue, the resistance may form at new highs, or profit-taking levels historically significant.


Conclusion and Consideration:

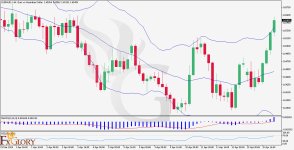
USD/ZAR shows signs of bullish continuation on the H4 chart, as suggested by the recent price action above the Bollinger Bands and the bullish MACD. Traders should monitor for potential overbought conditions given the RSI level. Any upcoming economic data from the U.S. or South Africa could further influence the pair’s direction. Given the bullish signals, traders may look for buying opportunities, keeping in mind the potential for pullbacks or corrections from overbought conditions. As always, traders should employ sound risk management strategies and consider the larger economic trends when making trading decisions.


Disclaimer: This analysis is for informational purposes only and does not constitute investment advice. Traders should conduct their own research and analysis before making any trading decisions.


FxGlory
10.04.2024


image_2024-02-15_07_27_41.gif
 

FXGlory Ltd

New member
BTCUSD analysis for 15.04.2024


BTCUSDH4.jpg


Time Zone: GMT +2
Time Frame: 4 Hours (H4)


Fundamental Analysis:


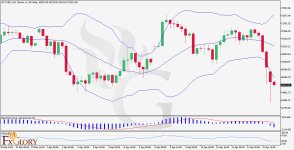
The BTCUSD pair is currently showing a significant bearish trend in the four-hour (H4) timeframe as of April 15, 2024. Fundamental factors such as regulatory news, technological updates within the blockchain ecosystem, and macroeconomic influences, including Federal Reserve policy shifts and inflation data, are important considerations that affect Bitcoin's price. Additionally, broader economic sentiment plays a crucial role, with Bitcoin often seen as a hedge against inflation or a risky asset during economic turbulence. The market's downward trajectory is highlighted by the breach of previous support levels and the creation of new lows, with strong selling pressure evident from consecutive bearish candle formations.


Technical indicators support the negative outlook; the MACD is significantly below the signal line, suggesting continued bearish momentum, and the histogram bars are growing, reinforcing this trend. The RSI is deep into oversold territory, which might either indicate an upcoming price correction or at least a temporary pause in the downtrend. The price is also trading below the lower Bollinger Band, pointing to a potential extension of the bearish trend but also hinting at a possible mean reversion since the price has strayed far from the moving average. Key levels to watch include $65,264.84 as current support and $69,379.94 as potential resistance if a reversal or pullback occurs. Given the market's state, traders should remain cautious, stay informed about relevant fundamental factors, and maintain rigorous risk management.


Disclaimer: The provided analysis is for informational purposes only and does not constitute investment advice. Traders should conduct their own research and analysis before making any trading decisions.


FxGlory
15.04.2024


image_2024-02-15_07_27_41.gif
 

FXGlory Ltd

New member
EURAUD analysis for 16.04.2024


EURAUD-H4 -Daily Technical Analysis on 16.04.2024.jpg


Time Zone: GMT +2
Time Frame: 4 Hours (H4)


Fundamental Analysis:


The EUR/AUD currency pair, representing the exchange rates between the Eurozone and Australia, is deeply influenced by a multitude of factors, including economic conditions, policy decisions from the European Central Bank (ECB) and the Reserve Bank of Australia (RBA), and political dynamics within the Eurozone. The Euro's value is particularly sensitive to the region's economic stability, monetary policies, and internal political events, while the Australian dollar fluctuates with changes in commodity prices and global economic sentiment, heavily leaning on exports to China. Currently, the Euro faces pressures from economic deceleration in some areas of the Eurozone, making ECB policies crucial for its near-term outlook. Conversely, the Australian economy, though robust, remains vulnerable to shifts in Chinese economic performance and international trade issues, factors that are vital to consider for predicting movements in the EUR/AUD pair.

On a technical analysis front, the EUR/AUD pair has exhibited a bullish trend on the 4-hour chart, indicated by a series of higher highs and higher lows, and is currently testing the upper boundary of the Bollinger Bands, signaling increased volatility and potential for continuation of the upward trend. Key technical indicators such as MACD and RSI support this bullish sentiment, with MACD showing a strong upward momentum and RSI suggesting there is still room for upward movement before the market hits the overbought territory. However, traders should remain cautious as approaching the upper Bollinger Band might also suggest upcoming resistance. The technical setup underscores the importance of monitoring support and resistance levels, which are currently marked by the Bollinger Bands, with the lower band providing potential support during pullbacks and the upper band posing as an immediate resistance level. Traders are advised to keep an eye on both fundamental and technical factors in their decision-making process to capitalize on potential trade opportunities presented by the EUR/AUD dynamics.


Disclaimer: This analysis is for informational purposes only and does not constitute investment advice. Traders should conduct their own research and analysis before making any trading decisions.


FxGlory
16.04.2024


FXGLORY.gif
 

FXGlory Ltd

New member
Gold Price Analysis for 17.4.2024


GOLD-H4.jpg


Time Zone: GMT +2
Time Frame: 4 Hours (H4)


Fundamental Analysis:


The upcoming jobless report from the Department of Labor, due on April 18th, is anticipated to have a significant impact on gold prices. A positive report, indicating fewer people out of work than expected, may strengthen the dollar, leading to a potential decline in gold prices. Conversely, a negative report could weaken the dollar, possibly driving gold prices higher. Investors should monitor this report closely as it could provide a key signal for future price movements in the gold market.

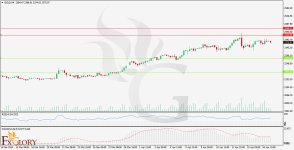
Technical analysis of gold prices shows that XAU/USD is nearing a critical resistance zone between $2420 and $2460, which could mark a turning point in the current bullish trend. Key indicators such as the MACD and RSI are suggesting a bearish reversal, with the MACD showing lower tops and the RSI displaying negative divergence. These technical signals, combined with the expected economic data, suggest that there may be a downturn in gold prices soon. Investors are advised to consider both fundamental and technical factors in their decision-making process.


Disclaimer: This analysis is for informational purposes only and does not constitute investment advice. Traders should conduct their own research and analysis before making any trading decisions.


FxGlory
17.04.2024


image_2024-02-15_07_28_16.gif
 

FXGlory Ltd

New member
BTCUSD analysis for 18.04.2024


BTCUSD----H4---Daily-Technical-Analysis-For-04.18.jpg


Time Zone: GMT +2
Time Frame: 4 Hours (H4)


Fundamental Analysis
:


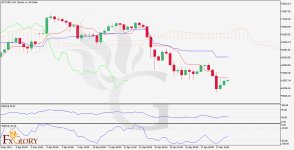
The BTCUSD analysis for April 18, 2024, on the 4-hour chart shows a clear downtrend as evidenced by the price moving below the Ichimoku cloud and key moving averages, suggesting a bearish sentiment in the short to medium term. Despite a slight recovery in recent price actions, the overall market condition remains under bearish pressure. Fundamental factors such as global economic uncertainties, inflation rates, regulatory changes, and the growth in decentralized finance and institutional investments continue to play a significant role in influencing Bitcoin's valuation against the US Dollar.

Key technical indicators like the Williams %R and RSI further support the bearish outlook. The Williams %R indicates oversold conditions, hinting at a potential short-term reversal, while the RSI remains below 50, suggesting continued bearish momentum. Resistance is set near the lower boundary of the Ichimoku cloud at approximately $62,388, with support around $59,025 and stronger support near $58,000. Given the prevailing market conditions and Bitcoin’s historical volatility, traders should remain vigilant, keeping an eye on macroeconomic indicators and regulatory news, while employing robust risk management strategies.


Disclaimer: The provided analysis is for informational purposes only and does not constitute investment advice. Traders should conduct their own research and analysis before making any trading decisions.


FxGlory
18.04.2024


image_2024-02-15_07_27_41.gif
 

FXGlory Ltd

New member
BCHUSD analysis for 19.04.2024


BCHUSDH4-Technical-Analysis---19.04.jpg


In the BCHUSD pairing, Bitcoin Cash's value against the US Dollar is subject to a myriad of influences, with regulatory shifts, technological developments, and general crypto market mood playing major roles. As a derivative of Bitcoin, BCH’s valuation is not only affected by its own market activities but also by the broader performance and updates within the Bitcoin network. Liquidity and the rate at which Bitcoin Cash is adopted for transactions and integrated into exchanges are also critical factors contributing to its market movements.

Currently, the four-hour chart reveals a predominant bearish trend for BCHUSD, characterized by a sequence of lower peaks and troughs. Although there's been a period of price consolidation, indicating a temporary equilibrium between buying and selling forces, the trend's overall direction leans towards a downward continuation. Technical indicators like the Bollinger Bands show the price hovering near the middle band, a neutral yet bearish sign, while the MACD suggests ongoing bearish momentum as it resides below the signal line. The RSI, sitting near 40, backs this sentiment, implying there’s scope for further decline. Support is presently seen around the $460 mark, with resistance near the $490 level, aligning with the 0.618 Fibonacci retracement. Traders should remain vigilant for any significant breaks from the current price range and stay updated with market news that could sway the BCHUSD trajectory. It's crucial to employ sound risk management strategies amidst the inherent volatility of the cryptocurrency domain.


Disclaimer: The provided analysis is for informational purposes only and does not constitute investment advice. Traders should conduct their own research and analysis before making any trading decisions.


FxGlory
19.04.2024


FXGLORY.gif
 

FXGlory Ltd

New member
EURUSD analysis for 22.04.2024


EURUSDH4-daily-analysis-on-22.04.2024.jpg


Time Zone: GMT +2
Time Frame: 4 Hours (H4)
Fundamental Analysis:

The EUR/USD currency pair is showing promising signs of a potential bullish reversal on the H4 chart as it consolidates following a downward trend. The sequence of higher lows could signal a shift towards euro strength against the U.S. dollar. Presently, the RSI stands at a balanced 53.17, indicating no immediate overbought or oversold conditions, while the MACD's positive divergence supports the potential upward momentum.


Key support at 1.06500 and resistance at 1.06920 are pivotal levels to watch. A definitive breakthrough the resistance might catalyze a bullish trend, underpinned by the Bollinger Bands, suggesting a readiness for heightened volatility. Traders should stay attuned to upcoming economic data and policy announcements from both the Eurozone and the U.S., which could critically affect the pair's trajectory. Effective risk management remains critical to navigating the uncertainties inherent in forex trading.


Disclaimer: The provided analysis is for informational purposes only and does not constitute investment advice. Traders should conduct their own research and analysis before making any trading decisions.


FxGlory
22.04.2024


image_2024-02-15_07_27_41.gif
 

FXGlory Ltd

New member
SILVER analysis for 23.04.2024


SILVERH4-Daily-Analysis-on-23.04.jpg


Time Zone: GMT +2
Time Frame: 4 Hours (H4)


Silver's performance against the US Dollar is heavily swayed by a variety of fundamental factors including industrial demand, mining production, and broader economic indicators that affect the USD. Its unique role as both an industrial commodity and investment asset makes its market movements particularly responsive to technological advancements, economic shifts, and geopolitical events. Presently, the metal is enduring a pronounced downtrend, as seen on the H4 chart, which suggests a strong selling pressure that has pushed the price below the lower Bollinger Band, potentially indicating oversold conditions.

Technical indicators paint a bearish picture for SILVER/USD, with the MACD showing continued negative divergence and the RSI deep into oversold territory, hinting at a possible impending reversal if buying interest returns. Current support is pegged at the recent price trough, around the 27.05 level, while resistance forms near the last low at 26.75. Traders are advised to keep an eye on key economic data and market sentiment, and exercise careful risk management, especially in anticipation of a possible trend reversal or further price stabilization.


Disclaimer: This analysis is intended for informational purposes only and should not be construed as financial advice. It is important for individuals to perform their own due diligence before engaging in trading activities.


FxGlory
23.04.2024


FXGLORY.gif
 

FXGlory Ltd

New member
Platinum analysis for 24.04.2024


PlatinumH4.jpg


Time Zone: GMT +2
Time Frame: 4 Hours (H4)


Fundamental Analysis:

Platinum's market behavior on the H4 chart indicates a continued downtrend, marked by a sequence of lower highs and lower lows. However, a recent slight upward movement suggests a temporary bullish retracement, which could present a short-term buying opportunity. This trend is further highlighted by the platinum price positioning near the lower Bollinger Band, typically a signal of an oversold condition or the persistence of a strong downtrend. The Relative Strength Index (RSI) being below 50 supports the bearish momentum, though it hasn't yet reached oversold levels, suggesting that the downtrend could continue or pause for a short reversal.

In terms of resistance and support, the current price level's immediate resistance is identified at the point where this retracement started, with a more substantial resistance potentially forming at the middle Bollinger Band. Should prices decline further, the recent low will serve as critical support, with additional support potentially appearing at lower levels not currently visible on the H4 chart. Given these technical indicators and the broader economic factors influencing platinum prices, such as industrial demand and supply dynamics, traders should remain vigilant for any shifts in market sentiment or macroeconomic updates that could impact price movements. Effective risk management is crucial due to the commodity's volatility.


Disclaimer: The provided analysis is for informational purposes only and does not constitute investment advice. Traders should conduct their own research and analysis before making any trading decisions.


FxGlory
24.04.2024


image_2024-02-15_07_27_41.gif
 

FXGlory Ltd

New member
XRPUSD analysis for 25.04.2024


XRPUSD.H4.Daily Analysis on 25.04.2024.jpg


Time Zone: GMT +2
Time Frame: 4 Hours (H4)


Fundamental Analysis:


The XRPUSD analysis for the 4-hour chart on April 25, 2024, presents a consolidation phase following a recent uptrend, indicating a market indecision around the 38.2% Fibonacci retracement level. The price action features smaller body candles with pronounced wicks on both ends, suggesting a lack of clear direction. Key technical indicators reinforce this view, with the RSI near a neutral 45 and the MACD showing weak bullish momentum as it hovers close to the signal line. The Bollinger Bands suggest a slight bullish bias as the price trends just above the middle band.

In terms of strategy, traders might adopt a wait-and-see approach, observing for a potential breakout above the 50% Fibonacci level to signify a continuation of the uptrend or a break below the 38.2% level to indicate a deeper retracement. Both the ongoing legal issues involving Ripple and broader market sentiment should be considered as they could significantly impact XRP's price movements. This analysis advises caution and emphasizes the importance of monitoring both technical signals and fundamental news flows to make informed trading decisions.


Disclaimer: The analysis provided is for informational purposes only and should not be considered as investment advice. Market participants should conduct their independent research and exercise caution when trading in volatile markets.


FxGlory
25.04.2024


image_2024-02-15_07_28_16.gif
 

FXGlory Ltd

New member
GBPNZD analysis for 26.04.2024


GBPNZD-H4--Daily-Technical-Analysis-on-26.04.jpg


Time Zone: GMT +2
Time Frame: 4 Hours (H4)


Fundamental Analysis:

The GBPNZD currency pair's current market sentiment is shaped by the interplay of the UK's economic indicators and New Zealand's commodity-driven economy. Influenced by policy decisions and economic reports from both countries, the pair is presently navigating through a zone of uncertainty, with mixed signals indicating a cautious market stance. Technical analysis reveals a tussle between bullish and bearish forces, as evidenced by the recent price activity around the Ichimoku cloud, signifying potential trend changes. The MACD suggests modest bullish momentum, while the neutral RSI points to a balanced market without a clear direction.

In conclusion, the GBPNZD pairing is at a crossroads, with technical indicators providing no clear trend direction. Traders should monitor upcoming economic announcements and be wary of the market's susceptibility to shift swiftly. Prudent risk management is advised, with attention to key support and resistance levels that may influence future price movements. While breaks above or below the Ichimoku cloud may signal stronger trends, the market currently demands a strategy that accounts for both volatility and ambiguity.


Disclaimer: The analysis provided is for informational purposes only and should not be construed as investment advice. Always perform your own due diligence before making trading decisions.


FxGlory
26.04.2024


FXGLORY.gif
 
Top