Gold falling

SebsCubs

New member
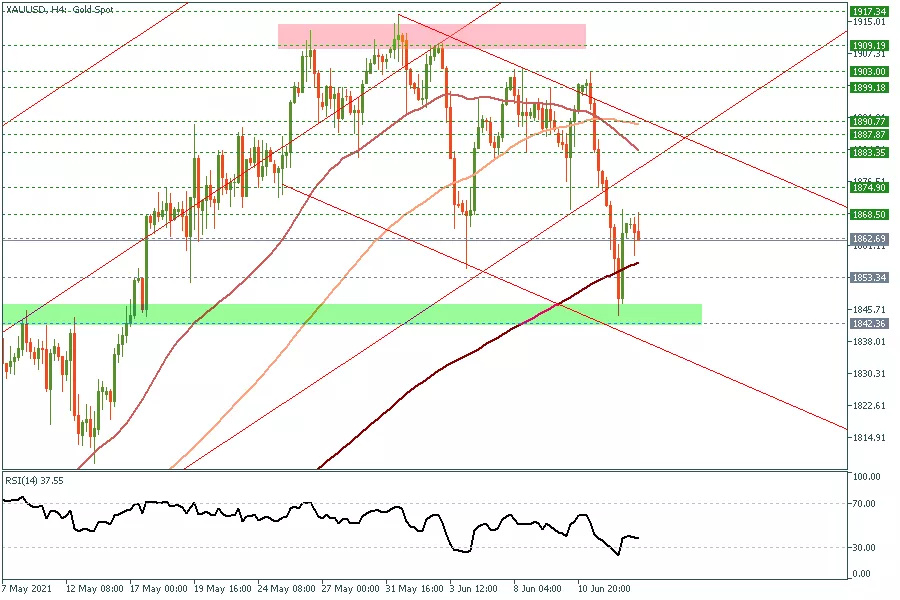
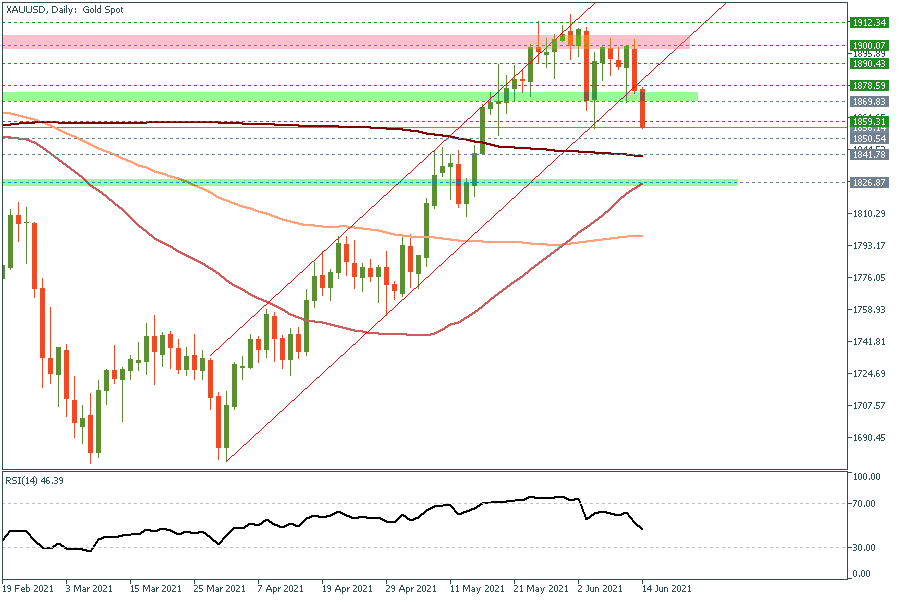
Gold prices tumbled on Friday and at beginning of the Asian session today, reaching as low as $1854/Oz, breaking through its upside channel on the daily chart, while the technical indicators are now clearly bearish, which confirms our short-term retracement outlook mentioned before since gold was trading above $1910. In the meantime, the key support for this week stands at $1840 which represents the 200-day MA, where gold is likely to show some stabilization, while we maintain our medium-term long positions that were issued back in April at $1710 and $1725 unchanged with a Stop Loss at $1730/Oz for now.
XAUUSD Daily.png


Reference: Gold's break down: what's next? (14.06.2021)
 

SebsCubs

New member
Gold prices tumbled during the first trading day of the week declining to as low as 1844 USD/Oz. However, it was able to trim these losses and closed the day around 1866 USD/Oz. Yet, the daily close is another bearish sign , since gold has broken the upside channel on the daily chart. Such a break remains in line with our expectations and the current downside retracement is not over yet. In the meantime, gold may retest its 200-day MA which stands around 1839 USD/Oz which likely to hold for a while before the uptrend resumes . Yet, we prefer to keep gold under our radar for few more days at least until the Federal Reserve decision, which would confirm whether gold will resume its major uptrend or the downside retracement has more legs to go.
image
100%•75%•50%

Reference: FBS (15.06.2021) Gold reached our retreacement traget.
 

SebsCubs

New member
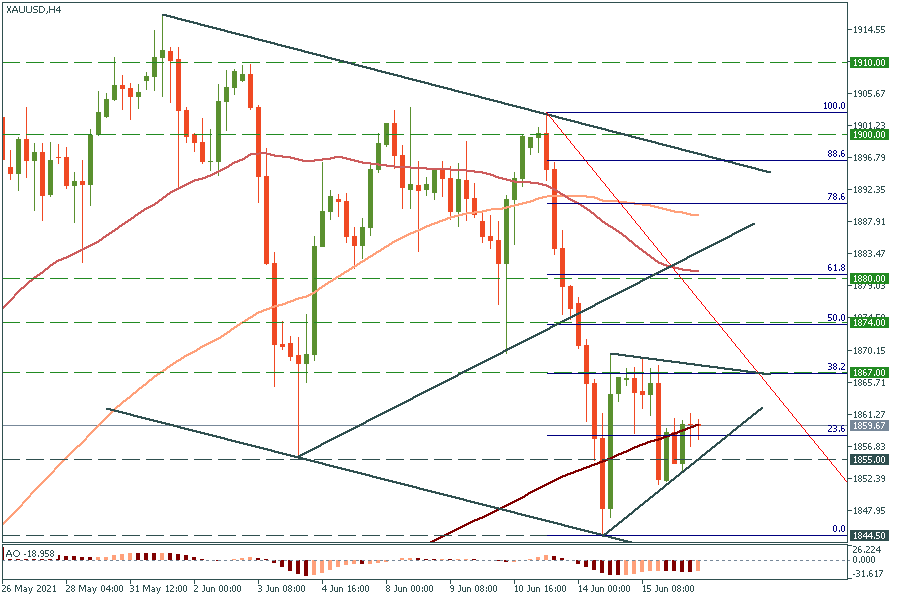
Everyone is interested in trading gold (XAU/USD). The meeting of the Federal Reserve at 21:00 MT time (GMT+3) will certainly drive the price. In this article, however, we’ll look at the technical side of things to see what opportunities lie there.

First, the uptrend since the end of March is still in place. On the weekly chart, there’s a 50-week MA just below $1855 – this level is supporting the price.

Second, on the D1 an Inside bar formed yesterday: it’s a sign that the price is consolidating ahead of the major breakout. The decline below $1855 will open the way down to $1845/$1840 (200-day MA). If XAU/USD stays above $1855, it will rise to $1867. A further breakout will bring the price shoot up to $1874 and $1880.

XAUUSDH4.png


Reference: FBS (16.06.2021) Gold: short term trade ideas.
 
Top