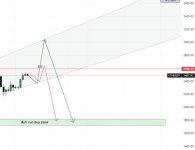
Crypto Technical Analysis By Capital Street Fx

Daily Crypto Analysis – Bitcoin’s comeback, Ethereum loss, XRP battle, Chainlink slide.​


Introduction​

Bitcoin aims for a resurgence above $40,000, leaving traders uncertain about its next move after a recent correction. Long-term Bitcoin holders transferred over $430 million to exchanges during the dip below $39,000. Ethereum faces a grim narrative, erasing all gains and highlighting vulnerability in the market. XRP engages in a fierce battle, holding above the crucial 200-day EMA at $0.55. Chainlink records a 3.87% decline to $13.80 within 24 hours, maintaining an average risk assessment based on price, volume, and market cap changes.

Markets In Focus Today – BITCOIN​

Bitcoin Price Eyes Comeback Above $40,000, Traders Unsure Of Where BTC Is Headed Next.

Bitcoin price made a comeback above $40,000 on Thursday, eyeing gains after the recent correction. Bitcoin’s long-term holders sent over $430 million in Bitcoin to exchanges as BTC dipped below $39,000. Bitcoin price suffered a setback after hitting its two-year high of $48,989 on January 11. The asset dropped to its 2024 low of $38,555 on Tuesday before beginning its recovery to the psychologically important level of $40,000. The approval of Bitcoin Spot ETFs by the Securities and Exchange Commission (SEC), ushered a volatility in crypto prices, and divided traders on their sentiment on BTC.

Technical Overview With Chart :

24-01-25_02-44-15_BTCUSD-1024x345.png

Moving Averages :

Exponential :

  • MA 10 : 41079.58 | Negative Crossover | Bearish
  • MA 20 : 41970.96 | Negative Crossover | Bearish
  • MA 50 : 41811.60 | Negative Crossover | Bearish

Simple :

  • MA 10 : 41202.25 | Negative Crossover | Bearish
  • MA 20 : 42838.70 | Negative Crossover | Bearish
  • MA 50 : 43009.09 | Negative Crossover | Bearish
RSI (Relative Strength Index): 38.68 | Sell Zone | Bearish

Stochastic Oscillator : 15.73 | Sell Zone | Positive

Resistance And Support Levels :

  • R1 : 44312.50 R2 : 45985.97
  • S1 : 38894.98 S2 : 37221.51

Overall Sentiment: Neutral Market Direction: Sell

Trade Suggestion: Limit Sell: 41074.25 | Take Profit: 38297.2 | Stop Loss: 42899.03

ETHEREUM​

Ethereum (ETH) Loses All Of Its Gains.

Ethereum has wiped out the gains it had accumulated over a sustained period. The ETH/USD price chart depicts a grim narrative as the digital asset has swiftly descended from its peak, retracing back to levels that question the sustainability of its prior growth. The steep decline in Ethereum’s price is a significant bearish signal. It reflects the market’s hesitancy to invest at previous highs, most likely due to the underperformance Ethereum has shown in the recent past. This lack of traction and inability to initiate a recovery underscores the vulnerability of Ethereum’s price in the current market climate.

Technical Overview With Chart :

24-01-25_02-48-20_ETHEREUM-1024x343.png

Moving Averages :

Exponential :

  • MA 10 : 2353.01 | Negative Crossover | Bearish
  • MA 20 : 2379.17 | Negative Crossover | Bearish
  • MA 50 : 2312.94 | Negative Crossover | Bearish

Simple :

  • MA 10 : 2402.64 | Negative Crossover | Bearish
  • MA 20 : 2422.75 | Negative Crossover | Bearish
  • MA 50 : 2336.48 | Negative Crossover | Bearish
RSI (Relative Strength Index): 39.83 | Sell Zone | Bearish

Stochastic Oscillator : 12.72 | Sell Zone | Neutral

Resistance And Support Levels :

  • R1 : 2411.05 R2 : 2505.56
  • S1 : 2105.10 S2 : 2010.59

Overall Sentiment: Bearish Market Direction: Sell

Trade Suggestion: Limit Sell: 2260.87 | Take Profit: 2106.80 | Stop Loss: 2373.30

RIPPLE​

READ THE FULL REPORT - CAPITAL STREET FX​


JacobWatson

Active member
Bitcoin's recent bounce back above $40,000 sure caught our attention, didn't it? But with all the volatility, it's like trying to ride a rollercoaster blindfolded!
Ethereum, on the other hand, had a bit of a rough patch, wiping out those hard-earned gains. It's a reminder of how swiftly things can change in the crypto world. One day you're up, and the next, well, it's a rollercoaster drop!
But have you ever thought about keeping your crypto transactions under wraps? That's where a crypto mixer comes in handy. It's like your invisibility cloak for the blockchain.
 

ImamShaheb

Valued Contributor
Based on the positive news that comes out , red or Green path may happen . Green is more probable than red.. & it's happening! IMG_20240215_171806.jpg IMG_20240215_171741.jpg
 

Weekly Crypto Analysis – Bitcoin $60K, Ethereum consolidates, XRP $1.​

Introduction​

Bitcoin (BTC) eyes the $60,000 mark but faces a potential correction, retesting a challenging resistance at $52,062. Ethereum (ETH) consolidates, providing a potential buying opportunity before the anticipated climb to $3,000. XRP inches closer to its $0.60 target, with a potential return to $1 contingent on positive developments in the SEC lawsuit. Uniswap experiences an 8.29% surge, contributing to a bullish week in the crypto space.

Markets In Focus Today – BITCOIN​

BTC Eyes $60,000 But Correction Looms.

Bitcoin price retests a tough resistance level at $52,062.A lack of momentum is likely to trigger a correction and consolidation for the next few weeks. Investors can expect BTC to remain between the $52,062 to $45,156 levels. Bounce at the lower end of the potential range could see a revisit of the $58,399 weekly resistance level. Bitcoin’s (BTC) price has been moving up only since January 22 but could slip into a consolidation before the next leg up. With the rate at which BTC is climbing after the ETF approval, coupled with strong fundamentals, investors should consider buying the dips before BTC hits $60,000.

Technical Overview With Chart :


fdc97bb9ebb0eb426522a95455bbf2c9f7032cec_2_690x231.png


Moving Averages :

Exponential :

  • MA 10 : 49684.4175 | Positive Crossover | Bullish
  • MA 20 : 47446.2413 | Positive Crossover | Bullish
  • MA 50 : 44753.5618 | Positive Crossover | Bullish

Simple :

  • MA 10 : 49581.1760 | Positive Crossover | Bullish
  • MA 20 : 46334.3660 | Positive Crossover | Bullish
  • MA 50 : 44301.5454 | Positive Crossover | Bullish
RSI (Relative Strength Index): 80.5399 | Buy Zone | Bullish

Stochastic Oscillator : 92.2206 | Buy Zone | Positive

Resistance And Support Levels :

  • R1 : 47387.2295 R2 : 49860.6039
  • S1 : 39380.2039 S2 : 36906.8295

Overall Sentiment: Bullish Market Direction: Buy

Trade Suggestion: Limit Buy: 50345.25 | Take Profit: 52855.56 | Stop Loss: 48970.85

ETHEREUM​

READ THE FULL REPORT - CAPITAL STREET FX​

 
Top